
Please refer to important disclosures at the end of this report
1
Government of India is divesting 9,33,12,000 shares (9.33% stake) in MMTC. It
has set a floor price of `60 (72% discount to CMP) for the OFS. We recommend
investors to AVOID subscribing to shares due to expensive valuation.
Company overview
MMTC was established in 1963 and is the largest trading company in India and
one of the major trading companies in Asia. It is a Mini Navratna compan
y
focusing on trading of commodities ranging form minerals to agro commodities.
It deals in Precious metals, fertilizers, Coal and Hydrocarbons, Metals, Agro
products and other minerals. MMTC also has a wholly owned subsidiary named
MMTC Transnational Pte Ltd (MTPL), Singapore and various joint ventures
including a pig iron plant in which MMTC holds 49.8% stake.
Investment arguments
Mineral exports to remain muted: The developments such as ban on iron ore
mining and export from Karnataka, regulation of export from eastern sector,
increase in railway freight and higher export duty for exports, increase in
domestic demand of ore iron ore etc have resulted in lower exports of iron ore in
India during FY2012. As per Federation of Indian Mineral Industries (FIMI), iron
ore exports from India had declined by 38.5% yoy to 62mn tonnes during
FY2012 on account of export ban in Karnataka, stringent measures in issuing
export permits in Odisha, a sharp decline in international iron ore price and
increased export duty. Further, as per FIMI, total iron ore exports during FY2014
are estimated to decline significantly, thus affecting top-line of MMTC.
The
increase in domestic steel production capacity has also reduced the availabilit
y
of Chrome and Manganese Ore for exports. Moreover, export duty on chrome
ore has increased beginning March 2012 from `3,000/tonne to 30% ad
valorem; all these factors are likely to impact MMTC’s sales volumes going
forward. Even gold imports into India are likely to be lower due to increase in
customs duty on gold by the government. This is further likely to hit MMTC’s top-
line going forward.
Historical financials highly volatile: The company’s financial performance has
been inconsistent and erratic over the past few years. During FY2012, its
consolidated net profit declined by 62.0% yoy to `43 cr. During FY2013, it
reported a net loss of `71cr on a standalone basis. (The company has not
reported consolidated FY2013 results). The past financials of the company do not
indicate stability in earnings going forward.
Valuation: MMTC is a trading company with a 'Five Star Export House' status.
However, at the current price, the stock is trading at a very expensive valuation o
f
398x FY2012 PE due to low free float (0.67% of its market cap). Even at a floo
r
OFS price of `60, it is trading at FY2012 PE of 113x, which is very expensive in
our view. Hence, we recommend investors to AVOID subscribing to MMTC OFS.
Bhavesh Chauhan
Tel: 022- 39357800 Ext: 6821
V
inay Rachh
Tel: 022- 39357600 Ext: 6841
MMTC
Expensive valuation despite huge discount
FPO
|
Metals
J
une 12, 2013

Metals
|
FPO
June 12, 2013
2
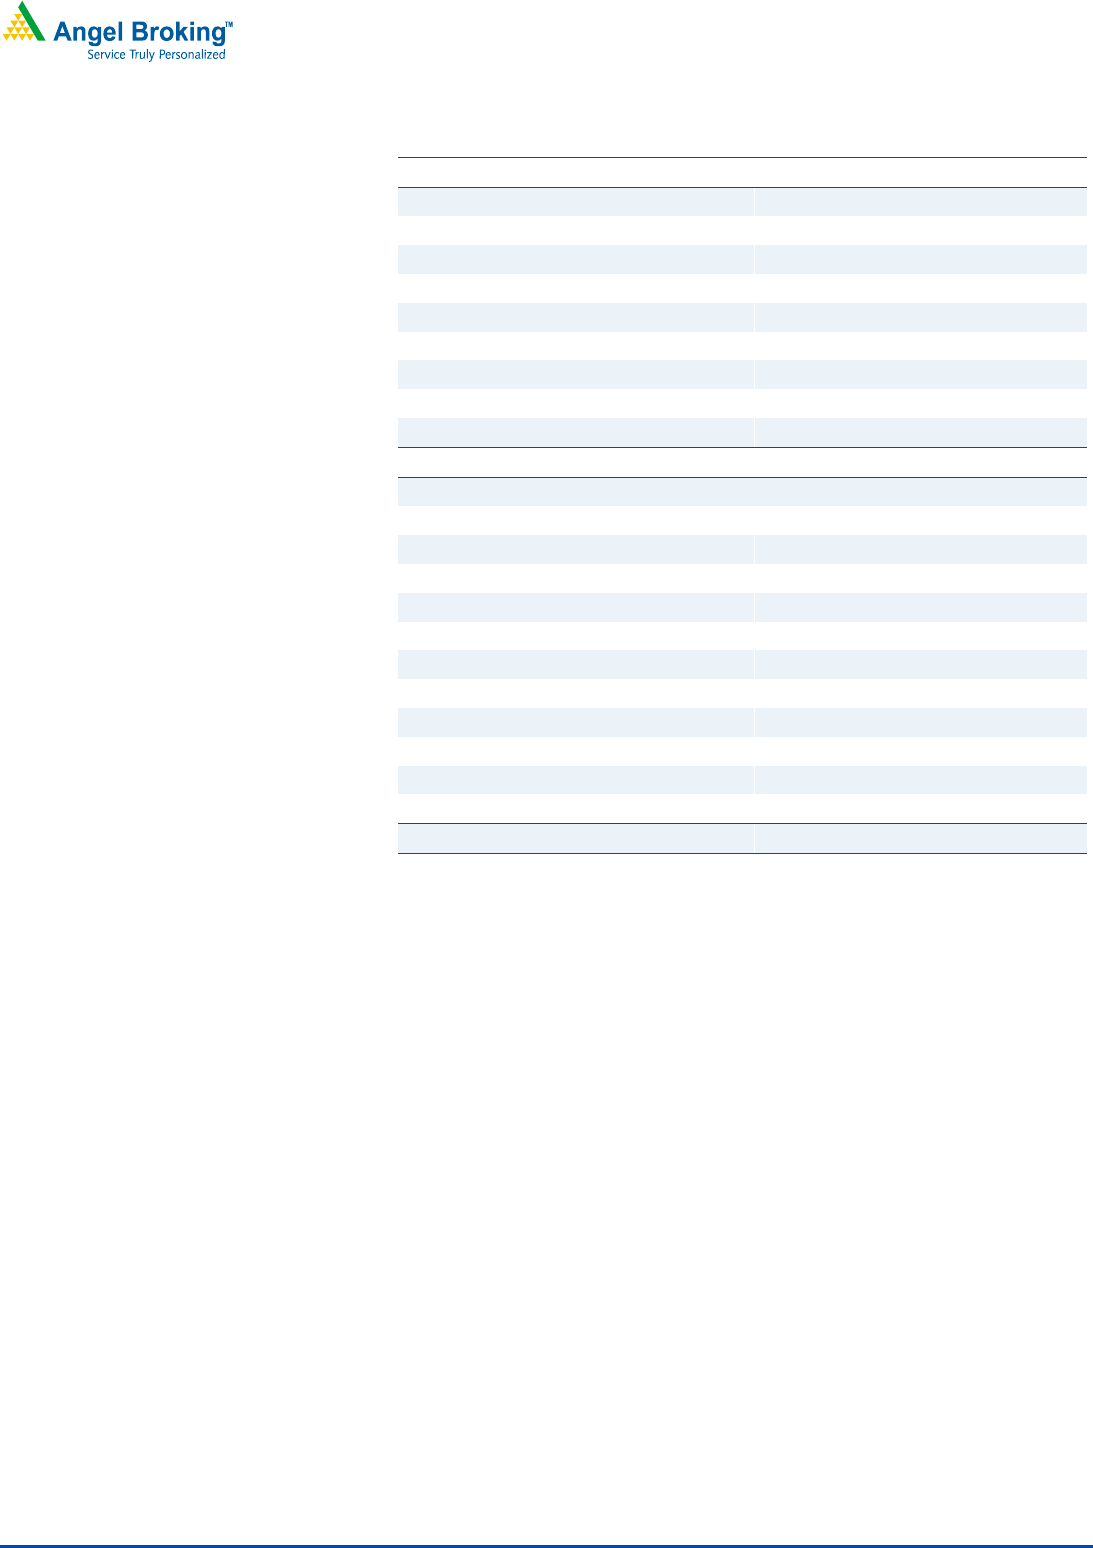
Profit & loss statement (Consolidated)
Y/E March (` cr) FY2009 FY2010 FY2011 FY2012
Net Sales
37,832 45,614 69,613 67,022
% chg
39.7 20.6 52.6 (3.7)
Total Expenditure
37,728 45,503 69,527 67,078
EBIDTA
104 111 86 (56)
(% of Net Sales)
0.3 0.2 0.1 -0.1
Other Income
841 669 510 709
Depreciation & Amortisation
13 14 14 14
Interest
687 416 399 590
PBT
245 350 184 49
(% of Net Sales)
0.6 0.8 0.3 0.1
Extraordinary Expense/(Inc.)
- - - -
Tax
81 120 71 6
(% of PBT)
33.1 34.1 38.8 13.1
PAT
164 231 112 43
% chg
(21.1) 40.7 (51.4) (62.0)
Adj. PAT
231 250 29 103
% chg
(21.6) 8.0 (88.3) 252.8
Metals
|
FPO
June 12, 2013
3
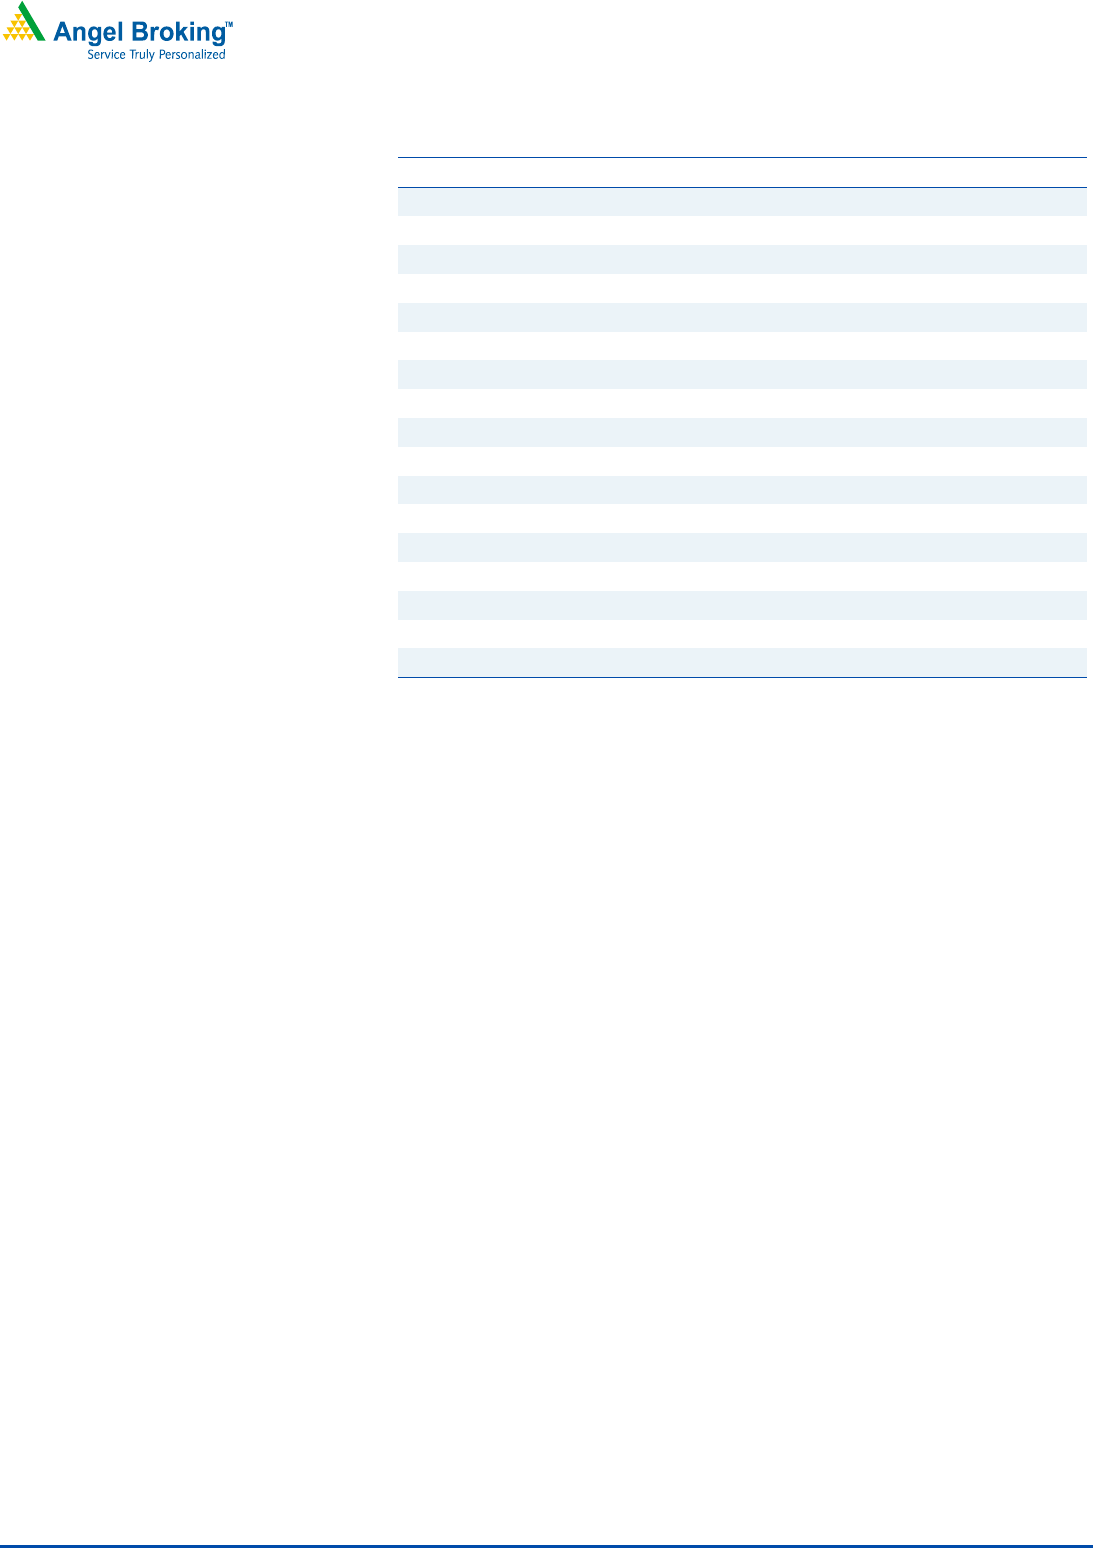
Balance sheet (Consolidated)
Y/E March (` cr) FY2009 FY2010 FY2011 FY2012
SOURCES OF FUNDS
Equity Share Capital
50 50 100 100
Reserves & Surplus
1,333 1,519 1,467 1,596
Shareholders’ Funds
1,383 1,569 1,567 1,696
Share warrants
- - - -
Minority Interest
- - - -
Total Loans
4,327 5,240 6,225 3,558
Other Liabilities
- - 130 148
Deferred Tax Liability (net)
(30) (22) (34) (71)
Total Liabilities
5,679 6,787 7,889 5,331
APPLICATION OF FUNDS
Gross Block
215 227 225 261
Less: Acc. depreciation
73 85 97 110
Net Block
142 142 128 151
Capital Work-in-Progress
21 90 134 118
Goodwill
- - - -
Investments
388 440 518 608
Current Assets
10,103 11,482 18,853 12,175
Current liabilities
4,980 5,367 11,857 7,837
Net Current Assets
5,123 6,115 6,995 4,338
Other assets
- - 114 117
Misc Expenditure
6 - - -
Total Assets
5,679 6,787 7,889 5,331
Metals
|
FPO
June 12, 2013
4
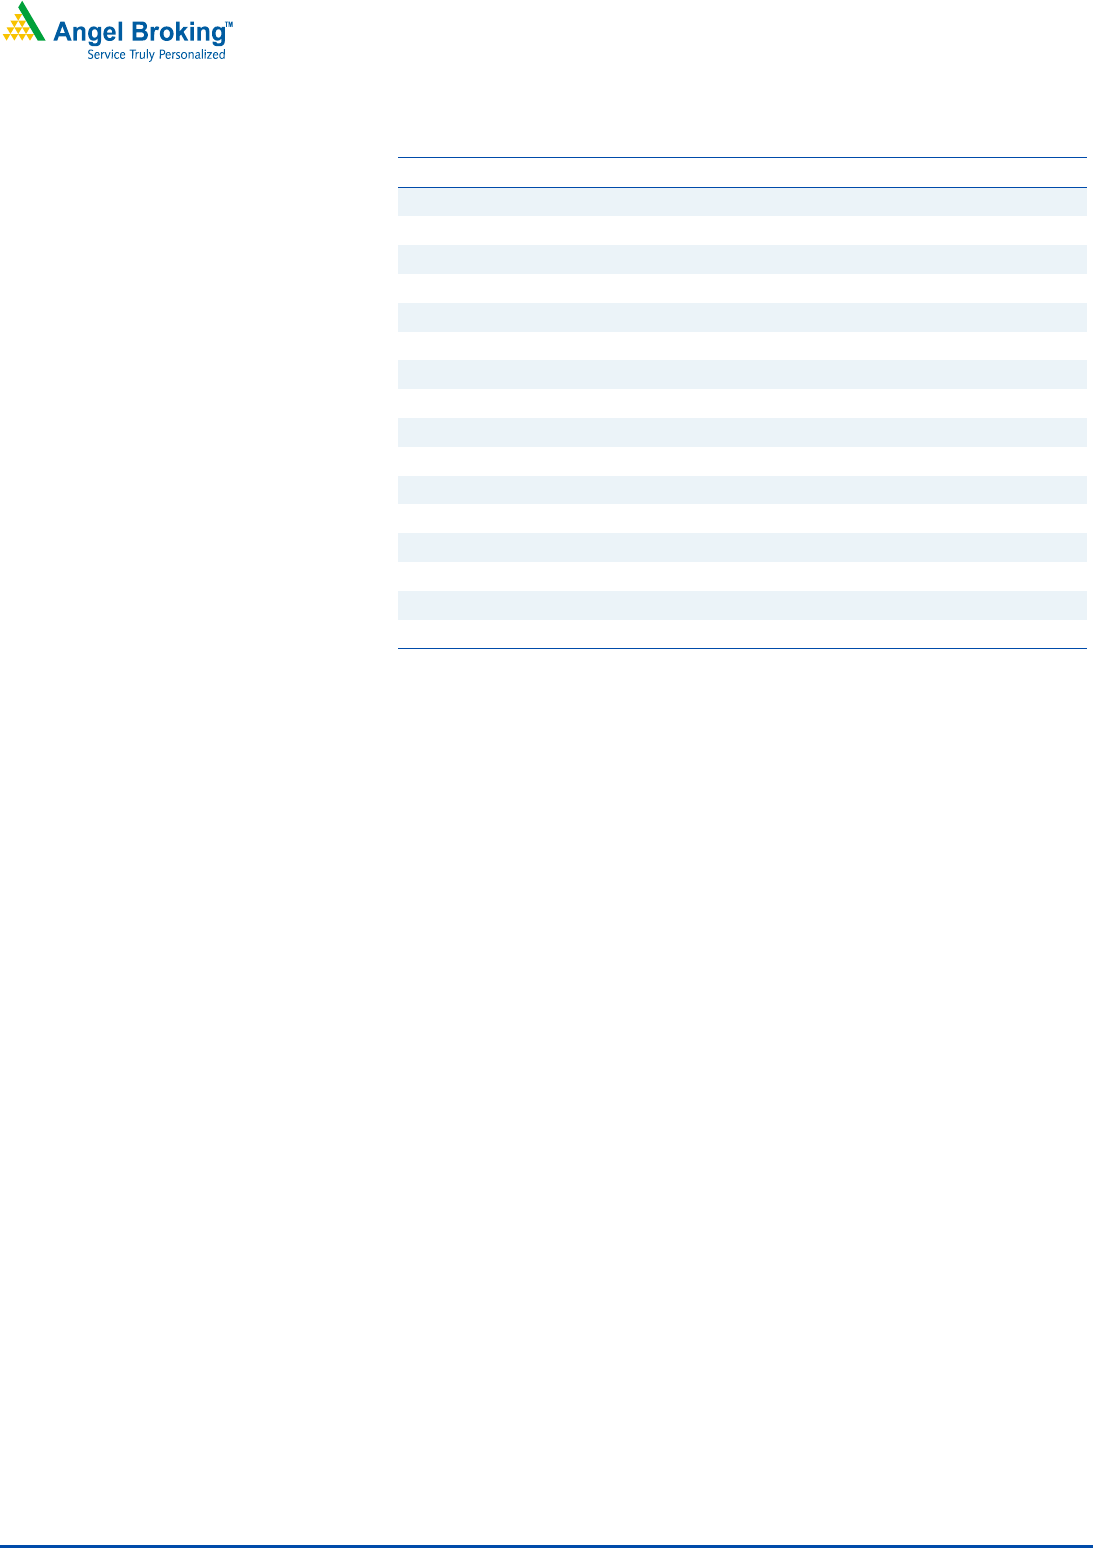
Cash flow statement (Consolidated)
Y/E March (` cr) FY2009 FY2010 FY2011 FY2012
Profit before tax
245 350 184 149
Depreciation
13 14 14 14
(Inc)/Dec in Working Capital
(1,326) (743) (181) (1,178)
Direct taxes paid
(108) (79) (92) (32)
Others
(68) (255) (92) (196)
Cash Flow from Operations
(1,243) (712) (168) (1,242)
(Inc.)/Dec. in Fixed Assets
(33) (83) (48) (22)
Free Cash Flow
(1,211) (629) (120) (1,220)
(Inc)/Dec in Investments
0 0 0 0
Others
(686) (415) (399) (591)
Issue of Equity
0 0 0 0
Inc./(Dec.) in loans
1,122 912 987 (2,666)
Dividend Paid (Incl.Tax)
(55) (23) (52) (29)
Cash Flow from Financing
381 474 535 (3,286)
Inc./(Dec.) in Cash
(58) 213 657 (3,887)
Opening Cash balances
6,022 5,965 6,178 6,835
Closing Cash balances
5,965 6,178 6,835 2,948
Metals
|
FPO
June 12, 2013
5
Key Ratios
Y/E March FY2009 FY2010 FY2011 FY2012
Per Share Data(`)
EPS (diluted)
39.4 48.5 0.2 0.5
Book Value
138.3 156.9 78.3 84.8
Ratios
EBITDA margin (%)
0.3 0.2 0.1 -
Adj. Net margin (%)
0.6 0.5 0.04 0.2
Net Debt/Equity
(1.5) (0.9) (0.7) 0.0
Returns %
RoE
15.5 17.9 9.1 8.4
RoCE
19.2 12.6 8.3 12.0
RoIC
- 37.98 10.94 -
Valuation Ratio (x)
P/E
2 1 273 113
P/BV
0.4 0.4 0.8 0.7
EV/Sales
0.0 0.0 0.1 -
EV/EBITDA
9.4 14.6 56.5 -

Metals
|
FPO
June 12, 2013
6
Research Team Tel: 022 - 39357800 E-mail: [email protected] Website: www.angelbroking.com
DISCLAIMER
This document is solely for the personal information of the recipient, and must not be singularly used as the basis of any investment
decision. Nothing in this document should be construed as investment or financial advice. Each recipient of this document should make
such investigations as they deem necessary to arrive at an independent evaluation of an investment in the securities of the companies
referred to in this document (including the merits and risks involved), and should consult their own advisors to determine the merits and
risks of such an investment.
Angel Broking Limited, its affiliates, directors, its proprietary trading and investment businesses may, from time to time, make
investment decisions that are inconsistent with or contradictory to the recommendations expressed herein. The views contained in this
document are those of the analyst, and the company may or may not subscribe to all the views expressed within.
Reports based on technical and derivative analysis center on studying charts of a stock's price movement, outstanding positions and
trading volume, as opposed to focusing on a company's fundamentals and, as such, may not match with a report on a company's
fundamentals.
The information in this document has been printed on the basis of publicly available information, internal data and other reliable
sources believed to be true, but we do not represent that it is accurate or complete and it should not be relied on as such, as this
document is for general guidance only. Angel Broking Limited or any of its affiliates/ group companies shall not be in any way
responsible for any loss or damage that may arise to any person from any inadvertent error in the information contained in this report
.
Angel Broking Limited has not independently verified all the information contained within this document. Accordingly, we cannot testify,
nor make any representation or warranty, express or implied, to the accuracy, contents or data contained within this document. While
Angel Broking Limited endeavours to update on a reasonable basis the information discussed in this material, there may be regulatory,
compliance, or other reasons that prevent us from doing so.
This document is being supplied to you solely for your information, and its contents, information or data may not be reproduced,
redistributed or passed on, directly or indirectly.
Angel Broking Limited and its affiliates may seek to provide or have engaged in providing corporate finance, investment banking or
other advisory services in a merger or specific transaction to the companies referred to in this report, as on the date of this report or in
the past.
Neither Angel Broking Limited, nor its directors, employees or affiliates shall be liable for any loss or damage that may arise from or in
connection with the use of this information.
Note: Please refer to the important `Stock Holding Disclosure' report on the Angel website (Research Section). Also, please refer to the
latest update on respective stocks for the disclosure status in respect of those stocks. Angel Broking Limited and its affiliates may have
investment positions in the stocks recommended in this report.
Disclosure of Interest Statement MMTC
1. Analyst ownership of the stock No
2. Angel and its Group companies ownership of the stock No
3. Angel and its Group companies' Directors ownership of the stock No
4. Broking relationship with company covered No
Ratings (Returns): Buy (> 15%) Accumulate (5% to 15%) Neutral (-5 to 5%)
Reduce (-5% to -15%) Sell (< -15%)
Note: We have not considered any Exposure below
`
1 lakh for Angel, its Group companie
s
and Directors